Your computer’s Central Processing Unit (CPU) is the powerhouse that drives your system, executing instructions and processing data. Whether you’re gaming, video editing, or just browsing the web, knowing how to check your CPU can help you optimize performance and troubleshoot issues. Understanding your CPU’s performance is crucial for ensuring that your system runs smoothly and efficiently, allowing you to enjoy a seamless computing experience.
“To check your CPU, use Task Manager on Windows or Activity Monitor on macOS for basic performance. For detailed information, consider third-party tools like CPU-Z or HW Monitor.”
In this article, We will discuss “ how to check cpu”
Table of Contents
Why Check Your CPU:

Monitoring your CPU is essential for several reasons:
Performance Monitoring:
Keeping track of your CPU’s performance can help you identify whether it is meeting your needs, especially during resource-intensive tasks. If your CPU is consistently running at high usage, it may be time to upgrade. Regular performance monitoring also allows you to pinpoint any potential bottlenecks in your system, ensuring that you maintain optimal performance for your applications and tasks.
Temperature Management:
High temperatures can lead to overheating, which can cause system instability, crashes, or even permanent hardware damage. Knowing how to monitor your CPU temperature is crucial for maintaining its health. By actively managing your CPU temperature, you can prolong its lifespan and ensure that your system operates at peak performance during demanding tasks.
Also Read: What Is The Normal CPU Temp – Essential Facts For PC Users!
Troubleshooting:
If you experience slow performance, application crashes, or system instability, checking your CPU can help diagnose the issue, whether it’s a cooling problem or high usage by specific applications. Identifying CPU-related issues early can prevent more severe problems down the line, allowing you to take corrective actions before significant damage occurs.
How to Check Your CPU: Step-by-Step Methods:

Using Task Manager (Windows):
Windows Task Manager provides a straightforward way to monitor CPU performance.
Step 1: Right-click on the Taskbar and select Task Manager , or press Ctrl + Shift + Esc .
Step 2 : In the Task Manager window, click on the Performance tab. Here, you’ll see a summary of CPU performance, including its current utilization percentage, clock speed, and the number of running processes.
Step 3 : To view more detailed information, click on CPU in the left panel. This displays graphs and additional metrics regarding your CPU performance, including utilization over time, temperature (if supported), and active processes using the CPU.
Tips for Task Manager:
- Resource Monitor: For deeper insights, you can access the Resource Monitor from the Performance tab by clicking on “Open Resource Monitor.” This tool provides detailed information about CPU, memory, disk, and network usage.
- Startup Impact: In the Task Manager’s Startup tab, you can also check which applications may be slowing down your system during boot-up and disable unnecessary ones.
Also Read: Why Is My CPU Overclocking Itself – Common Causes And Solutions!
2. Using Activity Monitor (macOS):
macOS users can utilize Activity Monitor to keep an eye on CPU performance.
Step 1: Open Activity Monitor by searching for it in Spotlight (press Command + Space and type “Activity Monitor”).
Step 2 : Click on the CPU tab. Here, you can see the percentage of CPU used by all running applications and processes, along with a graph of CPU usage over time.
Step 3 : At the bottom of the Activity Monitor window, you’ll find statistics such as the average CPU load and system vs. user CPU usage.
Tips for Activity Monitor:
- View Specific Processes: You can sort processes by CPU usage by clicking the “% CPU” column, helping you identify which applications are consuming the most resources.
Memory Pressure: Check the Memory tab to monitor how much RAM is being utilized, as memory shortages can also affect CPU performance.
Using Command Prompt (Windows):
For a quick check of your CPU’s specifications, use the Command Prompt.
Step 1: Press Win + R to open the Run dialog, type cmd , and hit Enter .
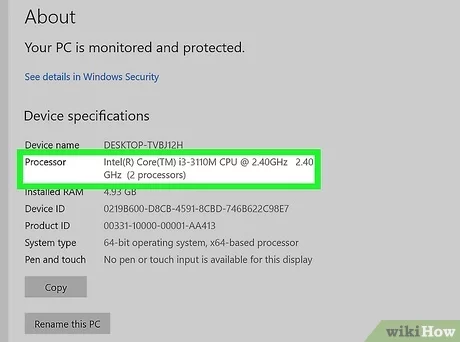
Step 2 : In the Command Prompt window, type the command `wmic cpu get name, currentclockspeed, max clock speed` and press Enter. This will display your CPU model along with its current and maximum clock speeds.
Using Third-Party Software:
For those seeking more comprehensive insights, numerous third-party applications can provide detailed CPU information and monitoring capabilities. Here are a few popular options:
- CPU-Z : This free tool provides extensive details about your CPU, including its architecture, clock speeds, cache information, and real-time monitoring of performance metrics.
- HWMonitor : This application offers detailed readings of your CPU temperature, voltage, and fan speeds, allowing you to keep an eye on system health.
- Core Temp : Specifically designed for temperature monitoring, Core Temp shows real-time temperature readings for each CPU core and can log data over time.
- MSI Afterburner : While primarily a GPU monitoring tool, it also provides CPU usage and temperature metrics, making it a popular choice among gamers.
Checking BIOS/UEFI Settings:

For a deeper look at your CPU’s specifications and settings, accessing the BIOS/UEFI can be beneficial.
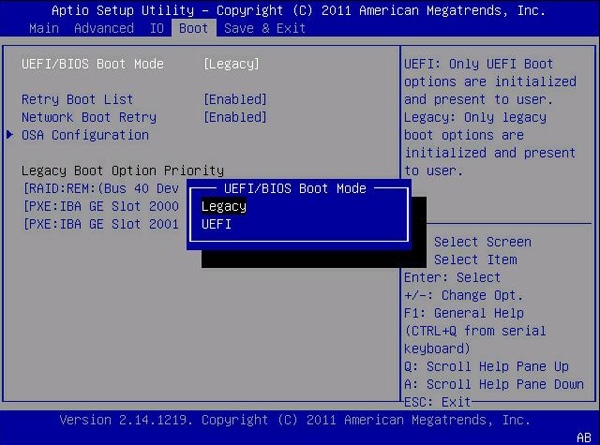
Step 1 : Restart your computer and enter the BIOS/UEFI by pressing the designated key (usually F2, Delete , or Esc ) during startup.
Step 2: Once inside, navigate to the System Information or Hardware Monitor section. This will provide detailed information about your CPU model, speed, temperature, and other related settings.
Tips for BIOS/UEFI:
- System Health : Many BIOS setups have health monitoring sections that display real-time temperature and voltage readings for your CPU and other components.
- Overclocking Settings : If you’re considering overclocking, the BIOS is where you’ll make adjustments to clock speeds, multipliers, and voltage settings.
Understanding CPU Load and Temperature:
What is CPU Load:
CPU load refers to the amount of work the CPU is currently handling. It’s measured as a percentage of the CPU’s capacity being utilized. A normal CPU load during idle periods is typically between 1% and 5%, while under heavy workloads, it can spike to 100%. Continuous high loads can indicate that your system is struggling to handle the tasks being performed.
Also Read: Intel Lga 1151 CPU List – Best Intel LGA 1151 Processors!
What is a Safe CPU Temperature:
Understanding safe temperature ranges is crucial for maintaining CPU health:
- Idle Temperature: A healthy idle CPU temperature ranges from 30°C to 50°C (86°F to 122°F).
- Normal Usage : Under moderate workloads, like browsing or office tasks, temperatures should be between 50°C and 70°C (122°F to 158°F).
- High Workloads: During gaming or intensive applications, temperatures can rise to 70°C to 85°C (158°F to 185°F).
- Critical Temperature: If temperatures consistently exceed 85°C, it’s a cause for concern. CPUs typically throttle performance or shut down when temperatures reach 95°C to 105°C (203°F to 221°F) to prevent damage.
FAQ’s
Here are five FAQs with short answers based on the article “How to Check CPU”:
1. How can I check my CPU usage in Windows?
You can check CPU usage by opening Task Manager (press Ctrl + Shift + Esc) and navigating to the Performance tab.
2. What tool can I use to monitor CPU temperature?
You can use third-party applications like HWMonitor or Core Temp for real-time temperature monitoring.
3. How do I access my CPU specifications in Windows?
Open Command Prompt and type `wmic cpu get name, currentclockspeed, maxclockspeed` to view your CPU model and clock speeds.
4. Can I check my CPU performance on macOS?
Yes, use Activity Monitor by searching for it in Spotlight and selecting the CPU tab to view usage statistics.
5. How do I check my CPU in the BIOS?
Restart your computer and enter BIOS/UEFI by pressing a designated key (like F2 or Delete) during startup. Look for the System Information or Hardware Monitor section.
Conclusion
In conclusion, checking your CPU is essential for monitoring its performance and ensuring your system runs efficiently. By using built-in tools like Task Manager on Windows or Activity Monitor on macOS, as well as third-party applications for detailed insights, you can easily assess CPU usage, temperature, and specifications. Regular monitoring helps maintain optimal performance and prevent potential issues, ensuring your computer operates smoothly.

